iGlance Dashboard
A Comprehensive view of Everything
iGlance Dashboard on VMS
For enterprises running business across a wide landscape, it becomes a pain in the neck to manage a large group of cameras scattered around. Now, a graphic-based "Dashboard" that visualizes every system statuses with graphs is here to ease the pain. Pies and bars let you draw conclusions quickly and provides clues that words can't. When dealing with massive data, graphics particularly show trends, gaps, and clusters.
For large projects like enterprises, government, or smart cities, iGlance Dashboard can substantially reduce the costs and labours for system maintenance and data analytics, while at the same time improves the institutions' services. For example, for a metropolitan police department, video system combining Big Data will help pinpointing crime hotspots based on where, what, and when a case was reported, and thus helps city police determine where to step up the search, inspection, or roadside check.
By using a new architecture, GVD brings an "iGlance" Dashboard to the VMS to quantify the video system's health, recording status, and number of recording days with statistics and various charts.
System iGlance
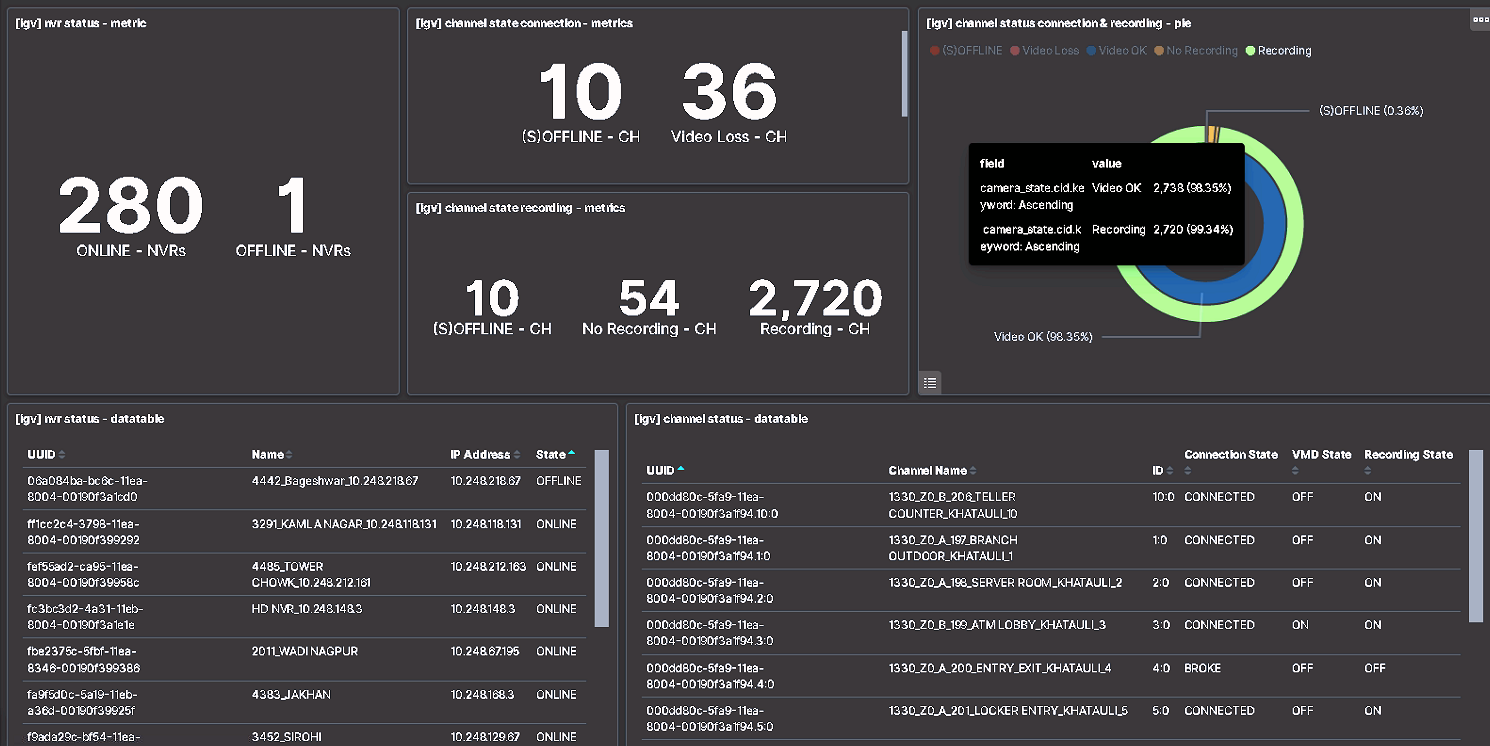
The System iGlance quickly sketches overall system statuses, including NVR Status, channel video connection status, and video recording status. Also, it auto runs graphs, such as the Channel Status Graphs, to form the images of overall channel status and lists, such as the Comprehensive Channel Status List, that breaks down every channel name and ID, recording status, video motion status, and the time last seen video-loss.
Every 60 seconds, the System iGlance auto updates these statistics: Numbers of the currently on-line but non-responsive NVRs, recording and not recoridng channels, as well as the numbers of "video-OK" and video-loss channels. A circle graph will also show to visualize how big the number of abnormal NVRs is in the system. When the mouse pointer is moved over the graph, more details become viewable.
Key data in the past seven days are summarized in bar charts, including daily alarm numbers and hourly alarm numbers. Different colors are for bars to represent different types of alarms, including: video-loss alarms, video motion alarms, CPU overheat alarms, and HDD repository damage alarms.
Every 60-second update
- NVR status, including online and offline NVRs
- Camera channel video connection, including video-ok and video-loss
- Video recording status, including recording, and not recording.
- Numbers of camera channels that are video-OK, video-loss, recording, and not recording.
Weekly key data in bars
- Daily numbers of alarms in the past 7 days
- Numbers of alarms by-type in the past 7 days
- Hourly numbers of video-loss alarms in the past 7 days
- Hourly numbers of video-motion alarms in the past 7 days
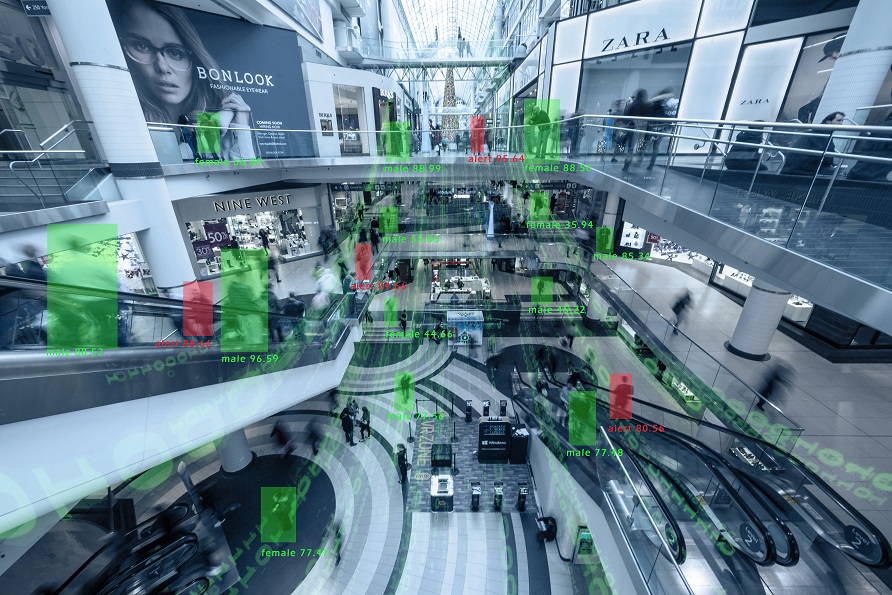
Application iGlance
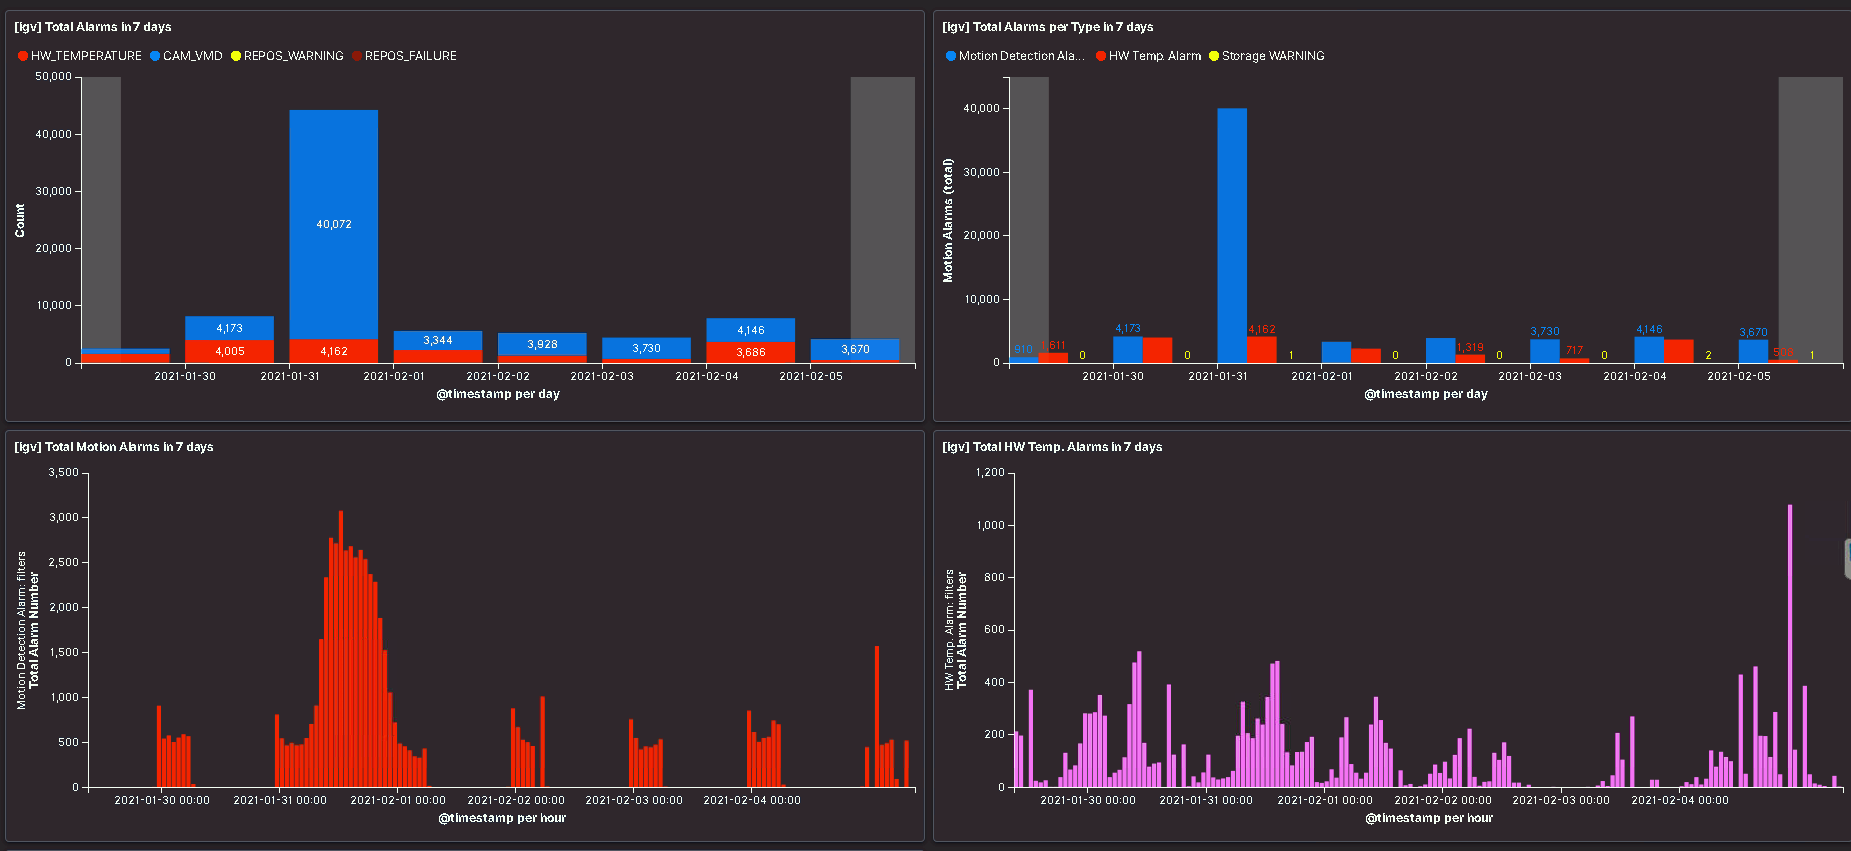
The Application iGlance is another type of iGlance that GVD VMS features. Unlike System iGlance, which reads data from system devices, the Application iGlance interprets the data from an sophisticated application, such as License-Plate Recognition, Facial Recognition, or POS on a business floor.
Application iGlance helps you know your customers better. By analyzing shopper dwell time, dwelt shelves, and shopped items, the Application iGlance helps you discover what customers like and dislike and predict what they are going to buy before walking out. So the next time they walk in, you only have to present what they are going to buy to them. With a little adjustment to your services or shelves, maybe you can sell more, and with some lucks, maybe workforce can be reduced.
Related Products
GVD VMS 4.0 Suites
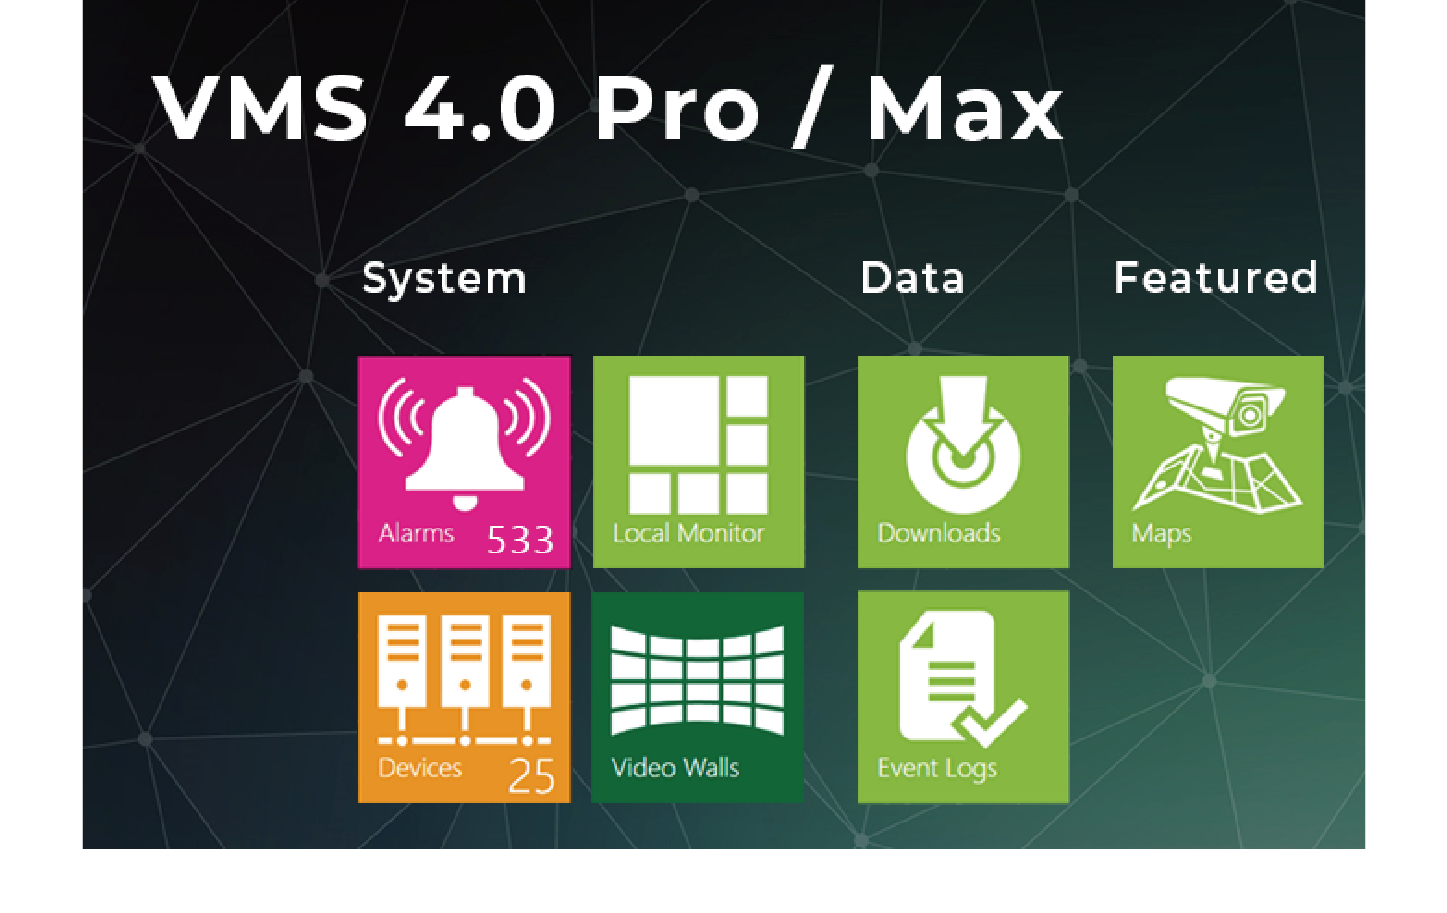
VMS 4.0 Pro, Max Packages
Pro-NVR Software, VMS Database, VMS Manager, Recipe Manager, VMS Videowall
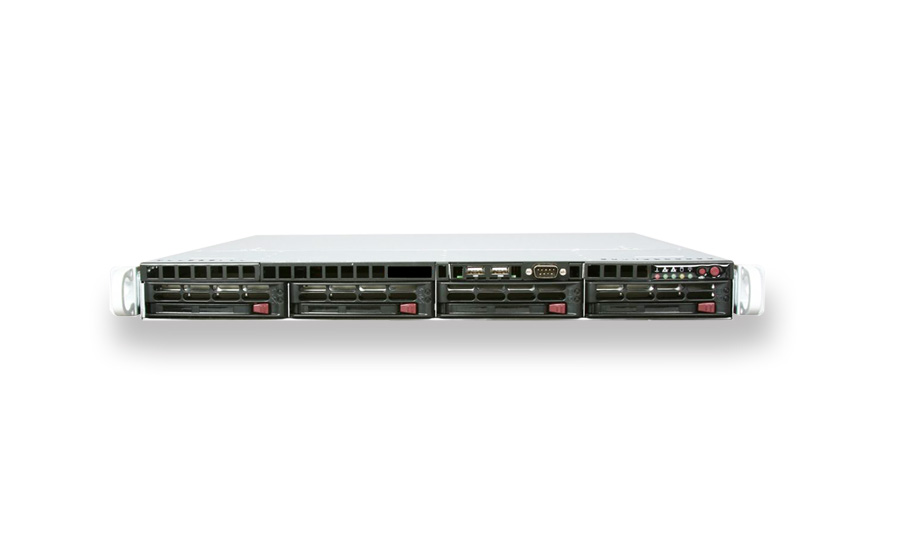
VMS 4.0 Servers
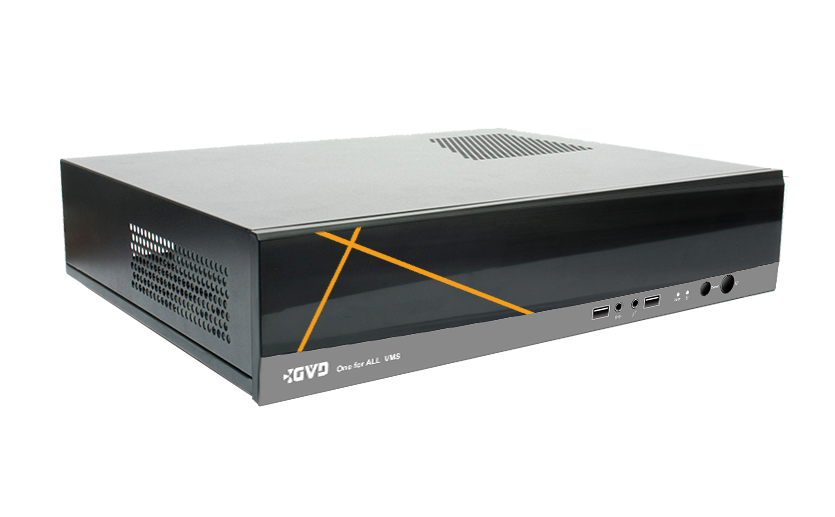
E4200, E2200, D4200, SW-E1100
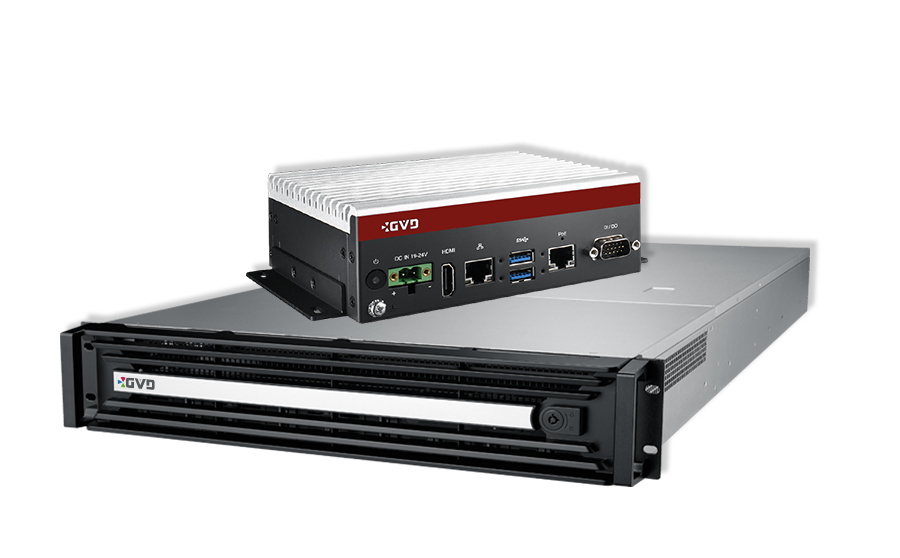
VMS Workstation, Conductor, & Videowall Decoder
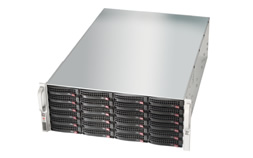
X8024
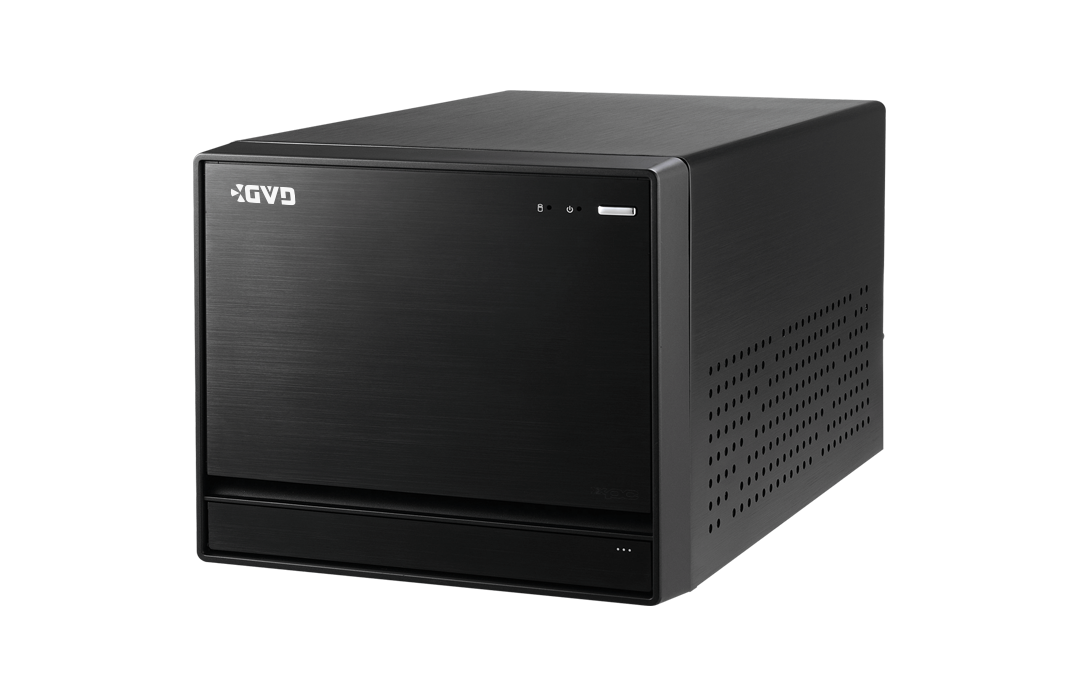
Archive Server
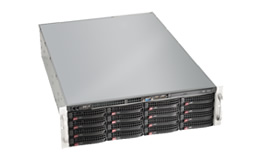
X5016
Failover Server